| FRQ# | Question | Topic | Concept(s) |
|---|
2001
#1 |
- 1. (a) (i)
- Define the term “Green Revolution” as used during the period 1945 to 1985.
- (ii)
- Explain the principal agricultural practices/technologies associated with the green revolution.
- (iii)
- Name TWO regions, in different parts of the world, where the green revolution has had a significant impact on crop yields.
(b) Identify and discuss TWO social, political, or cultural conditions necessary for the success of the agricultural practices/technologies of the green revolution.
(c) Identify and discuss TWO significant economic or ecological factors that may limit the long-term success of the agricultural practices/technologies of the green revolution.
|
5-Agriculture
|
- Green Revolution
- regional differences
- sustainability
- social, political and/or cultural preconditions
- ecological and economic limitations
|
2001
#2 |
2. The development of suburbs in North American metropolitan areas has greatly accelerated since the 1950’s and 1960’s.
Discuss how THREE of the following have contributed to this acceleration.
- (a) Transportation
- (b) Housing production
- (c) Landscape preferences
- (d) Social and demographic trends
|
7-Cities
|
- suburbs
- housing developments
- transportation infrastructure
- highways
- cultural landscape
- preferences
- social and demographic trends
- Changes since the 1960s in specific focus:
- counter-urbanization
- white flight
- congestion
- pollution.
|
2001
#3 |
3. According to the Rostow model, countries move through the following five stages of economic development:
- Stage 1: Traditional
- Stage 2: Preconditions for takeoff Stage 3: Takeoff
- Stage 4: Drive to maturity
- Stage 5: High mass consumption
Explain the usefulness of the model in understanding contemporary social and economic change with reference to any THREE of the following:
- (a) A country’s role in the world economy
- (b) Colonial transportation networks
- (c) Cultural differences
- (d) Local social and class structures
Be sure to support your answers with examples from any of the following regions:
- Latin America
- Sub-Saharan
- Africa South Asia
|
6-Development
|
Rostow Model
development (LDC)/ colonial legacy World Systems/ social class structures/ cultural differences
|
2002
#1 |
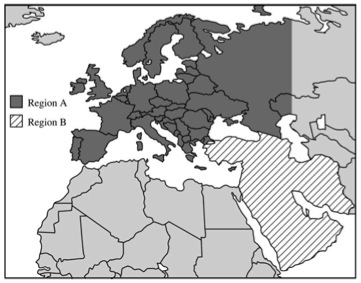
1.
- A. Define the following concepts as they are used in political geography.
- 1. Nation
- 2. State
- 3. Nation-state
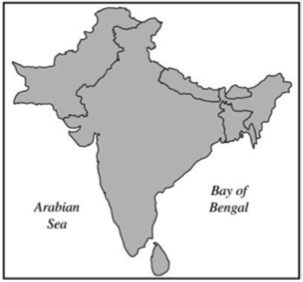
- B. For each of these concepts, name a specific late-twentieth-century example from Region A and a specific late-twentieth-century example from Region B on the map above.
- C. Explain how the pursuit of the nation-state ideal during recent decades has led to conflict in each of the two Regions A and B on the map above.
|
4-Political
|
Nation/ State/ Nation-state Conflict resulting from pursuit/ Compare and contrast (geographical region) Europe vs West Asia
|
2002
#2 |
2. With reference to each of the following, explain how religion has shaped the cultural landscape. Support each explanation with one specific example.
- A. Sacred sites
- B. Burial practices/sites
- C. Architecture
- D. Place names
|
3-Culture
|
- sacred sites
- preservation
- pilgrimmage
- tourism
-
- place
- religion
Place (site)
Changes to the land/ sacred spaces
|
2002
#3 |
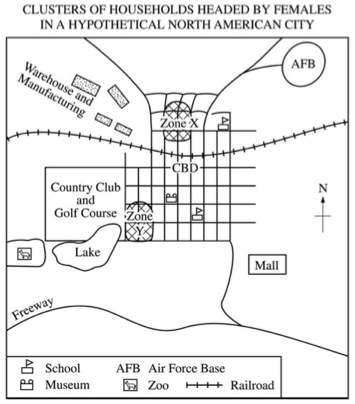
3. Zone X and Zone Y are two different types of neighborhoods with high concentrations of households headed by females. Use the map above to answer the following questions.
- A. Briefly describe TWO socioeconomic factors that have led to the concentration of households headed by females in Zone X and TWO socioeconomic factors that have led to the concentration of households headed by females in Zone Y.
- B. Discuss one advantage OR one disadvantage of the Hoyt sector model for understanding the location and characteristics of Zones X and Y.
|
7-Cities
|
Models of land use (Hoyt-sector)Socio-economics (class) and urban location (land-rent, living expense).Female-headed household (gender perspectives) |
2003
#1 |
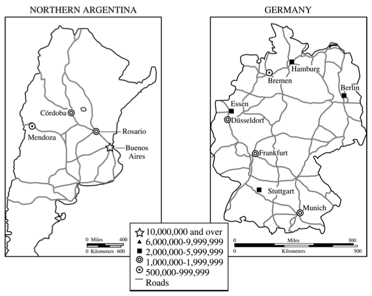
1. Discuss THREE ways in which the concept of core-periphery relations helps explain the development of the urban systems shown above. Be sure to use evidence from both maps to support each of your conclusions.
|
6-Development
|
Core-Periphery
Central-place theory
transportation infrastructure
colonial legacy |
2003
#2 |
2. A. Identify and explain ONE way that tourism has diminished regional landscape distinctiveness.
B. Identify and explain ONE way that tourism has enhanced regional landscape distinctiveness.
|
6-Development
|
Landscape distinctiveness
Tourism and diffusion
cultural landscape
Tourism as a development strategy, positive and negative
|
2003
#3 |
3. Over the last 150 years, Europe has changed from a source to a destination region for international migration.
- Use the demographic transition model to explain briefly Europe’s development as a source of international migrants between 1800 and 1920.
- Identify and briefly explain ONE factor other than demographic transition that was responsible for Europe’s development as a source of migrants to the United States between 1800 and 1920.
- Briefly explain how THREE aspects of the demographic transition model account for Europe’s transformation into a destination region for migrants from North Africa between 1960 and 2000.
|
2-Population
|
Migration (international)
Push-pull factors
Demographic Transition Model
Change over time/ Europe
|
2004
#1 |
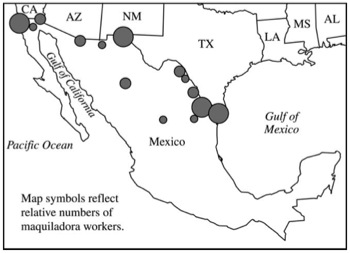
1. The map above shows the main maquiladora centers in Mexico in the year 2000.
- A. Define a maquiladora.
- B. Refer to the map above to explain the spatial distribution of maquiladoras within Mexico.
- C. Discuss FOUR factors that explain why Mexico has emerged as an important location in the current global system of industrial organization.
|
6-Development
|
Maquiladora (free-zones) International division of labor Friction of distance (distance decay), NAFTA (supranationalism)
|
2004
#2 |
2. There structuring of agriculture in the late twentieth century has had important implications for rural land use and the distribution of poultry (chicken and turkey) production in the United States.
- A. List TWO factors that have increased the demand for poultry.
- B. Briefly describe TWO characteristics of the present economic organization of poultry production in the United States.
- C. Describe TWO features of the present geographic distribution of poultry production in the United States.
|
5-Agriculture
|
Industrial Agriculture Consolidated ownership of poultry processing Activity (industrial) location/ Consumer preferences/ transportation
|
2004
#3 |
3. The graph shown above describes the residential density profile of a major North American city. The population pyramids labeled X and Y describe the demographic composition of places located at points X and Y on the graph of population density.
- A. Use the concept of land rent (sometimes called bid-rent) to explain the profile of residential population density shown on the graph.
- B. Using the population pyramids labeled X and Y, identify and explain TWO differences in the demographic composition between the pyramids.
- C. Explain the relationship between the demographic differences identified in part B, above, and residential land use patterns at point X and point Y, respectively, in the graph of population density.
|
7-Cities |
Land-Rent
Land-rent vs. population density, Demographic composition vs. housing preferences
Population pyramid (age-structure) and housing location choice.
|
2005
#1 |
1. The modern state system is engaged in a struggle between the forces of supranationalism and devolution.
- A. Define both terms and give a geographic example for each.
- B. With reference to the political and economic geography of Europe, briefly discuss three changes resulting from supranationalism.
- C. With reference to the political and economic geography of Europe, briefly discuss three changes resulting from devolution.
|
4-Political
|
Nation-state system Supranationalism/ Devolution, Tension within system in Europe (EU)
|
2005
#2 |
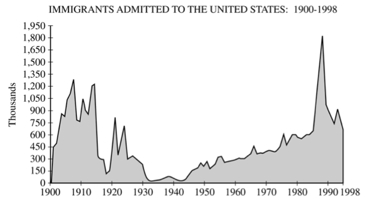
2. Peaks in immigration to the United States reflect changing circumstances at the global scale. Refer to the graph above to answer the following.
- A. Identify the main source areas and explain two key push factors associated with the early twentieth- century peaks.
- B. Discuss how change in the economic structure of the United States promoted immigration in the early twentieth century.
- C. Identify the main source areas and explain two key push factors associated with the late twentieth- century peak.
- D. Discuss how change in the economic structure of the United States promoted immigration in the late twentieth century.
|
2-Population
|
Migration (international)
Push-pull factors
Change over time/ US historical trends, late 19th & late 20th century
|
2005
#3 |
3. In the 1990’s the central business and residential districts of cities in the United States became the focus of a revitalization process. Discuss how each of the following has contributed to this revitalization process.
- A. Economic factors
- B. Demographic composition
- C. Urban policy
- D. Sense of place
|
7-Cities |
Urban renewal
Economic factors (capital improvements), demographic composition change, government policy (empowerment zones), place
Gentrification, cultural landscape and sense of place
|
2006
#1 |
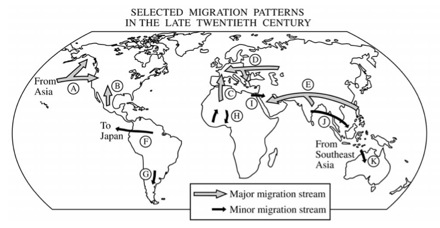
1. International migration in the late twentieth century illustrates many important geographic principles.
- A. Define each of the following principles.
- 1. core-periphery 2. distance decay 3. chain migration
- B. For each principle in part A, select a migration stream identified by letter on the map above, and discuss how the stream you choose illustrates the principle. Note: Each lettered migration stream may be used only once.
|
2-Population
|
Migration (international)Contemporary trends in migration sources and destinations, economic and political push-pull factors.Core-periphery/ Distance decay/ Chain migration |
2006
#2 |
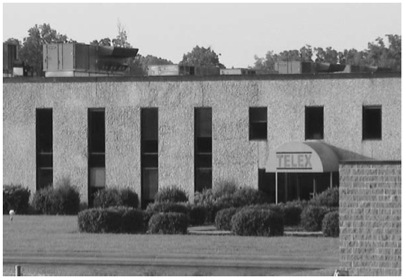 2. The photograph above, taken in a small town in Arkansas, shows a customer service call center in a building that until recently wash an automotive parts manufacturing plant.
- A. Identify two reasons why businesses would choose to locate their call centers in small southern towns.
- B. Discuss three disadvantages in the use of call centers as a local economic development strategy.
|
6-Development |
telecommunications (call centers)/ economic sectors Development strategy (MDC)/ deindustrializationfootloose industries
|
2006
#3 |
3. The viability of any state depends on a balance between centripetal and centrifugal forces.
- A. Define the concepts "centripetal force" and centrifugal force".
- B. Give a specific example of and explain a centripetal force that affects the viability of any of the states shown on the map above.
- C. With reference to a different specific example, explain a centrifugal force that affects the viability of any of the states shown on the map above.
|
4-Political
|
Colonial legacy Nation-state Centripetal & centrifugal forces/ political sustainability |
2007
#1 |
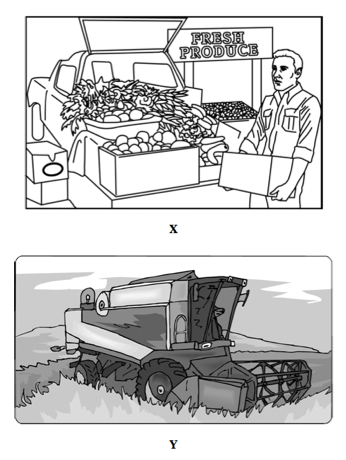
1. The drawings above reflect agricultural activities in the hinterland of a large urban area.
- A. Apply the underlying principles of von Thünen’s agricultural land-use model to predict the locations of the activities shown in X and Y relative to a large urban area.
- B. Choose either activity X or activity Y and apply the underlying principles of von Thünen’s agricultural land-use model to explain the location of the activity.
- C. Discuss two factors that explain why agricultural land-use patterns today differ from those developed by von Thünen’s model in 1826.
|
5-Agriculture
|
vonThünen Change over time to land use (technology, industry, consumer tastes)
|
2007
#2 |
2. At the same time that English is solidifying its role as the world’s premier lingua franca, lesser-used minority languages (such as Welsh, Basque, and Inuktitut) are undergoing revival. Discuss three distinct factors promoting the revival of minority languages in the face of globalization.
|
3-Culture
|
Language
Lingua-franca/ Minority-language
Action-Reaction (cause and effect) of English as a lingua-franca
|
2007
#3 |
3. Economic restructuring is transforming the world economy.
- A. Define and discuss the key features of the new international division of labor (also known as global division of labor).
- B. Explain an impact of the new international division of labor on the socioeconomic structure of the United States.
- C. Explain an impact of the new international division of labor on the socioeconomic structure of developing countries such as Mexico, China, and India.
|
6-Development
|
International division of laborWorld Systems Theory/ developing nations (China, Mexico, India)deindustrialization (MDC)/ development (LDC)
|
2008
#1 |
1. Von Thünen’s model of land use and Burgess’ model of land use are similar in appearance but different in their geographic setting. Analyze and discuss the two models in terms of each of the following:
- For each of these models, identify the type of land use the model addresses.
- Identify two assumptions that are shared by both models.
- For each of these models, explain how relative location affects land-use patterns.
|
5-Agriculture
|
Burgess (Concentric) Model
vonThünen Model
Land-rent
land use (activity area)
urban vs. rural setting
|
2008
#2 |
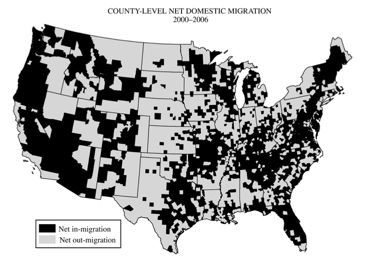
2. Regional migration patterns within the contiguous United States are the result of several factors. The map above shows net migration at the county level, but these data support generalizations about migration patterns at the regional scale.
- Identify two specific regions that have experienced net in-migration.
- Identify two specific regions that have experienced net out-migration.
- Explain the processes that contribute to the general patterns of migration within the United States shown on the map in terms of each of the following:
- 1. Economic structure
- 2. Friction of distance
- 3. Age structure of the population
|
2-Population
|
Contemporary US migration patterns/ Age structure (demographic) change/ economic changeMigration (internal)
Push & pull factors/ Distance decay/ regional migration
|
2008
#3 |

3. Countries in the graph above have been chosen to illustrate an important trend in educational patterns in the developing world.
- A. Identify the trend shown in the graph above.
- B. Identify and explain an effect of this trend on population growth in the developing world.
- C. Identify and explain an effect of this trend on economic development in the developing world.
- D. Identify and explain an effect of this trend on gender roles in the developing world.
|
6-Development
|
Education Geographical variation of educationGender/ population growth/ gender roles
|
2009
#1 |
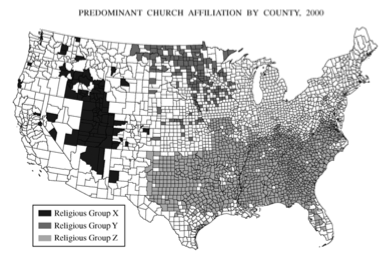
1. The map above shows the distribution of three religious groups in the contiguous United States.
- A. Using the letters in the legend, name the three religious groups shown on the map.
- B. For ONE of the three religious groups, first identify and then explain TWO factors that have influenced the distribution shown on the map.
- C. Explain how the map as presented at this scale is an incomplete representation of the geography of religion in the United States.
|
3-Culture
|
Religion
Diffusion of religion
Religion & US regional geography
|
2009
#2 |
2. A large proportion of urban residents in the megacities of the periphery of the world system live in squatter settlements.
- A. Describe a typical location of squatter settlements within urban areas of megacities on the global periphery.
- B. Describe two factors that contribute to the formation of squatter settlements.
- C. Give a detailed account of THREE consequences of the rapid growth of squatter settlements. The three consequences you discuss may be social, economic, political or environmental.
|
6-Development
|
urbanization (LDC)Economic, political, environmental consequences of rapid developmentshantytowns/ ghettos
|
2009
#3 |
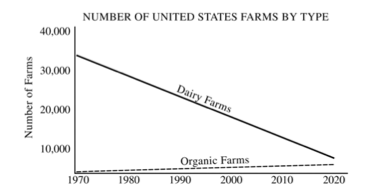
3. Agriculture in the United States has changed significantly in the past few decades. With respect to the past, present, and projected trends in agriculture shown in the diagram above, answer the following:
- A. First identify and then explain TWO factors contributing to the steady decline in the number of dairy farms since 1970.
- B. First identify and then explain TWO factors contributing to the increase in the number of organic farms since 1970.
|
5-Agriculture
|
- Industrial agriculture
- economies of scale
- consumer preference
consolidated ownership
- Organic farming
|
2010
#1 |
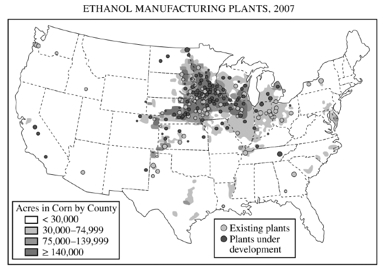
1. According to Alfred Weber’s theory of industrial location, three factors determine the location of a manufacturing plant: the location of raw materials, the location of the market, and transportation costs.
- A. Using an example of a specific industry other than the one portrayed on the map above, explain under what conditions an industry would locate near the market.
- B. Using an example of a specific industry other than the one portrayed on the map above, explain under whatconditions an industry would locate near raw materials.
- C. Using the map above and Weberian theory, explain the geography of ethanol plants in the United States.
|
6-Development
|
industrial location theory (Weber) |
2010
#2 |
2. Since 1950 many states have faced challenges in developing a strong national identity.
- A. Using contemporary examples, explain how each of the following has contributed to the development of national identity and the strengthening of a state.
- 1. Economic development
- 2. Relocation of a state’s capital (since 1950)
- B. Using contemporary examples, explain how each of the following may detract from the development of national identity and weaken a state.
- 1. Ethnicity
- 2. Transportation infrastructure
|
4-Political
|
national identity
|
2010
#3 |
3. The population pyramids above represent two countries at different stages of the demographic transition and economic development.
- A. Explain the demographic characteristics of each country above with respect to the demographic transition model.
- B. Discuss ONE positive impact of EACH country’s population structure on its economic development.
- C. Discuss ONE negative impact of EACH country’s population structure on its economic development.
|
6-Development
|
dependency ratio
|
2011
#1 |
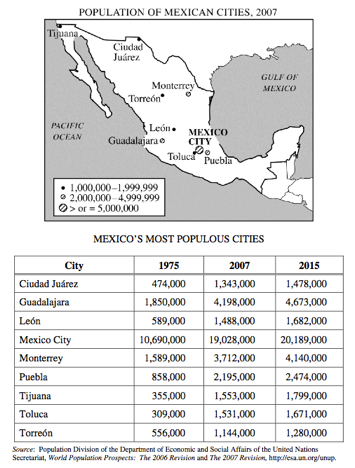
1. The map and table above show the geographic location, population growth, and projected growth of Mexico’s most populous cities.
- A. Define the following terms and describe how each relates to Mexico’s urban geography.
- • Primate city
- • Rank-size rule
- B. Explain TWO positive effects of primate cities on a country’s economic development and TWO different negative effects of primate cities on a country’s economic development.
|
7-Cities
|
rank-size rule, primate city, economic development
|
2011
#2 |
2. In 1798 Thomas Robert Malthus published An Essay on the Principle of Population in which he argued that population growth will inevitably outpace food production, resulting in widespread famine.
- A. Identify and explain TWO reasons why some geographers today believe Malthus’ theory can be used to predict future population issues.
- B. Identify and explain TWO reasons why some geographers today believe Malthus’ theory cannot be used to predict future population issues.
|
2-Population
|
Malthus, neo-Malthusian
|
2011
#3 |
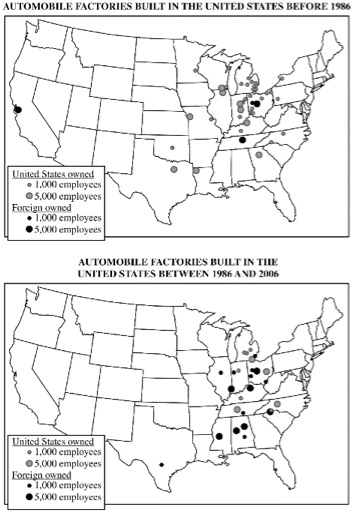
3. Industrial location models are used to explain geographic patterns of economic activity. The maps above show automobile factories built before and after 1986 in the United States.
- A. Identify TWO changes in the geography of automobile factory construction shown by the maps.
- B. Identify and explain TWO factors related to industrial location that may have contributed to the changes.
|
6-Development
|
Weber (industrial location theory)
|
2012
#1 |
1. Walls and other barriers built by countries to establish their borders are some of the oldest and most controversial elements in the cultural landscape.
- a. Identify three examples of walls or other barriers built by countries in the twentieth and twenty-first centuries.
- b. Explain the purpose of one of the examples you identified in part a.
- c. For each of the categories listed below, discuss a consequence faced by countries as a result of walls or other barriers established along their borders.
- i. social or political
- ii. economic
- iii. environmental
|
4-Political
|
concepts here
|
2012
#2 |
2. The map above shows areas of shifting cultivation, a form of subsistence agriculture.
- Define subsistence agriculture.
- Describe the practice of shifting cultivation.
- Explain one reason why shifting cultivation was sustainable in the past.
- Explain two reasons why shifting cultivation is expected to diminish during the twenty-first century.
|
5-Agriculture
|
list concepts
|
2012
#3 |
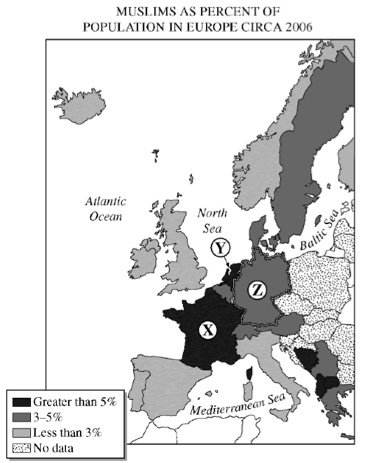
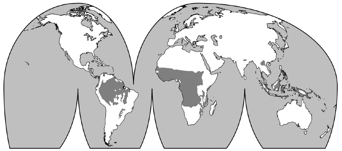
3. European countries have experienced an increase in Muslim population in recent decades. The map above shows the distribution and proportion of Muslims by country.
- a. Identify Countries X, Y, and Z on the map above.
- b. Explain two reasons for the increase in Muslim immigration to one of these countries since 1950.
- c. For the country you selected in part b, discuss the impacts of the Muslim population increase on the country’s
- i. urban spatial organization
- ii. population structure
- iii. social relations
|
4-Political
|
decolonization
|
2013
#1 |
1. The high-tech centers of Silicon Valley in California and the Research Triangle in North Carolina developed in the past 40 years.
- Discuss the following three factors that contributed to the rise of such industrial regions.
- 1. Investment capital
- 2. Labor
- 3. Government
- Define the concept of agglomeration and explain its role in the continuing expansion of such regions.
|
6-Development
|
agglomeration
|
2013
#2 |
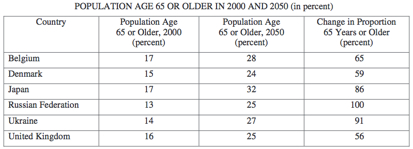
2. The average age of the population in selected developed countries listed in the table above has been increasing.
- Identify and explain two reasons that the average population age is increasing in developed countries.
- Identify and explain one social consequence and one economic consequence that countries face as their populations age.
|
2-Population
|
graying population
dependency ratio
|
2013
#3 |
3. Over the past 150 years, railroad and highway systems influenced patterns of urban growth in the United States.
- A. Identify and explain one way that railroads affected the size and one way that railroads affected the form of cities in the United States between 1870 and 1920.
- B. Identify and explain two ways that the Interstate Highway System affected cities in the United States between 1950 and today.
|
6-Development
|
transportation infrastructure
|
2014
#1 |
1. Rostow’s five-stage model of economic growth and the core-periphery concept of Wallerstein’s three-part world system theory are two of the more common economic development models.
- Identify and compare three differences between the stages of economic growth and the core-periphery model.
- Use one of the two models to explain the level of economic development in either Mexico or Brazil.
- Give two examples of how the core-periphery concept can be applied below the national scale.
|
6-Development
|
Rostow, Wallerstein (Core-Periphery)
|
2014
#2 |
2. The international borders of African countries are a legacy of colonialism.
- Describe the concept of a superimposed boundary.
- Describe three political or cultural consequences of superimposed boundaries in Africa.
- Identify and explain one challenge landlocked African countries face in developing viable economies.
|
4-Political
|
colonial legacy
|
2014
#3 |
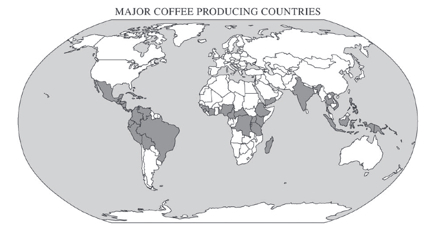
3. Agricultural systems, such as the production of coffee, are part of a global network.
- Describe a common characteristic shared by the coffee producing countries shown on the map.
- Explain two impacts of coffee farming on producing countries.
- Identify and explain one way increased coffee consumption outside of coffee growing areas affects its production.
- Explain one change in the urban landscape in the developed world associated with coffee consumption.
|
5-Agriculture
|
climate
plantation agriculture
supply and demand
specialty retailer
|
2015
#1 |
|
|
|
2015
#2 |
|
|
|
2015
#3 |
|
|
|
2016
#1 |
|
|
|
2016
#2 |
|
|
|
2016
#3 |
|
|
|